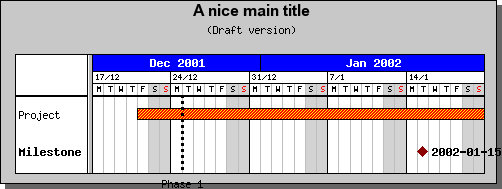
Figure 153: Adding a vertical line with a title to the Gantt chart [src]
The final object you may add to a Gantt chart is simple, but quite useful, a straight vertical line extending over the whole plot height. This could for example be used to illustrate different phases in a project. You create a line object by a call to GanttVLine()
The full signature for GanttVLine() is
function GanttVLine
($aDate,$aTitle,
$aColor,
$aWeight,
$aStyle)
$aDate
| Date for the milestone | |
$aTitle
| Title for the line. The title is displayed at the bottom of the line | |
$aColor
| Color for the line | |
$aWeight
| Line width | |
$aStyle
| Line style,"dashed", "dotted" and so on |
Valid creations of lines are for example
 $vline = new
GanttVLine(
"2001-12-24");
 $vline = new
GanttVLine(
"2001-12-24",
"Phase 1");
 $vline = new
GanttVLine(
"2001-12-24",
"Phase 1",
"darkred");
 $vline = new
GanttVLine(
"2001-12-24",
"Phase 1",
"darkred",5);
 $vline = new
GanttVLine(
"2001-12-24",
"Phase 1",
"darkred",5,"dotted"
);
To add the line to the graph you just have to call GanttGraph::Add() as with milestones and bars. Let's illustrate the use of vertical lines by adding a line to the previous example.
  $vline
= new GanttVLine
("2001-12-24","Phase 1");

$graph->Add(
$vline);
and the example (See 153) now becomes
From the above figure you can see that by default the line is drawn at the beginning of the day of the specified date and in a 'dashed' style. This can (of course!) be modified so that the line is drawn/aligned anywhere in the specified day. You modify this by invoking the method SetDayOffset() with an argument specifying the fraction of the day where you want the line positioned.
If you, for example, want to display the line in the middle of the day just add the line
  $vline->SetDayOffset(
0.5);
to the previous code and the result will be
As usual you may modify the font, size and color by invoking the appropriate method (SetFont(), SetColor()) on the 'title' property of lines.