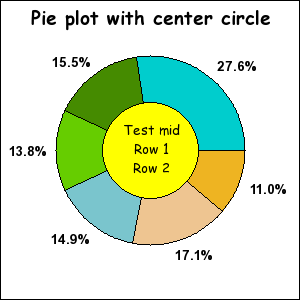
Figure 137: Example of the variant of pie plot with a filled center circle [src]
As mentioned in the beginning there are two versions of the 2D pie plots. The normal pie plot created as an instance of class PiePlot and a variant created as an instance of class PiePlotC
This variant is an extension of the standard PiePlot in the sense that it also have a filled circle in the center. The following example illustrates this
Since the PiePlotC is an extension to the basic pie plot all the normal formatting you can do for pie plots you can also do for the PiePlotC .
The additional formatting only concerns the filled middle circle. You have the option of adjusting size, fill color and all font properties. You perform these operations with the methods
| PiePlotC::SetMidColor() | Set fill color of mid circle |
| PiePlotC::SetMidSize() | Set size (fraction of radius) |
| PiePlotC::SetMidTitle() | Set title string (may be multi-lined) |
| PiePlotC::SetMid() | Set all parameters in a single method call |
In addition to the normal CSIM for PiePlot:s the center area is also a CSIM hotspot. You specify the target CSIM with a call to PiePlotC::SetMidCSIM()
The next example shows an example with some more innovative formatting. In this example we have :